Catalogue PIGMA
0.25 degrees
Type of resources
Topics
Keywords
Contact for the resource
Provided by
Years
Formats
Representation types
Update frequencies
status
Resolution
-

-
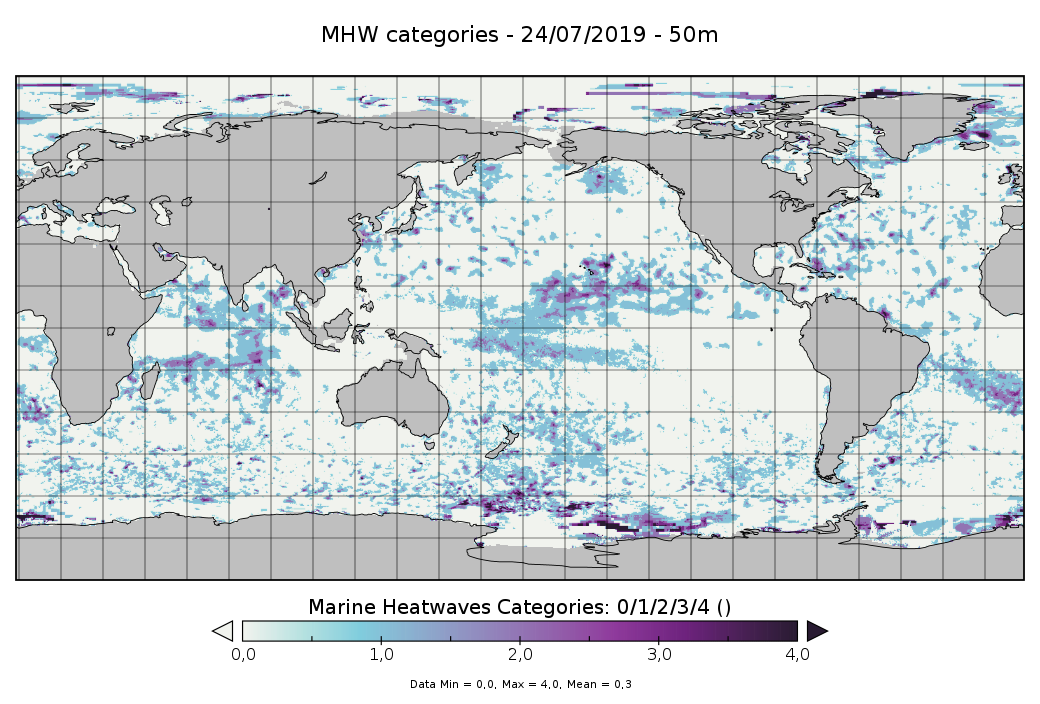
These datasets contain 4D (x, y, z, t) weekly temperature and marine heatwaves (MHW) categories estimated from the surface up to 300-m depth, at a 0.25°x0.25° horizontal grid resolution and for 4 areas of interest that are: • Area 1 (around the Madeira Islands): 30°N-35°N, 15°W-20°W • Area 2 (Tropical Pacific Ocean): 30°S-30°N, 120°E-130°W • Area 3 (Mediterranean Sea): 40°N-45°N, 15°W-20°W • Area 4 (Global): 82.875°S-89.875°N, 0.125°E-359.875°E The weekly MHW are centered on the date of the file (±3days). For the temperature reconstruction, 2 approaches have been used: - for the regional areas, the temperature has been computed with a 2 steps method: a first estimate of the vertical temperature profiles by using a machine learning approach (Multi-Layer Perceptron (MLP)) and then, a combination of this field with in situ temperature profiles observations through an optimal interpolation algorithm. The Copernicus Marine Service ARMOR3D dataset was used as the targeted temperature field for the MLP. The input data used are: • First step: ◦ SST data are from daily OSTIA analyses [from Copernicus Marine Service: SST_GLO_SST_L4_REP_OBSERVATIONS_010_011 product] interpolated over the 0.25°x0.25° targeted grid resolution; ◦ SLA data are from the Copernicus Marine Service product SEALEVEL_GLO_PHY_L4_REP_OBSERVATIONS_008_047/dataset-duacs-rep-global-merged-allsat-phy-l4 • Second step: ◦ The in situ data are from the Copernicus Marine Service In Situ TAC and contains several observations type: CTD, Argo floats, drifting buoys, moorings, marine mammals). - For the global area, the temperature comes from the Copernicus Marine Service product ARMOR3D (MULTIOBS_GLO_PHY_TSUV_3D_MYNRT_015_012 (https://doi.org/10.48670/moi-00052). The MHW categories are derived from the Hobday’s method [Hobday et al.,2018] for the 4 areas. Each MHW event is classified among four categories (moderate to extreme), identified in terms of multiples of the local difference between the 90th percentile and climatological values, and defined as moderate (1-2×, Category I), strong (2-3×, Category II), severe (3-4×, Category III), and extreme (>4×, Category IV). When the category is zero, this means that there is no MHW. The period 1993-2021 is used as a baseline for defining the climatology to be as close as possible to the 30-year period suggested by Hobday. This choice is motivated by the need of altimetry data to constrain the vertical temperature reconstruction, which is required for most ocean reanalyses as well, therefore the baseline period slightly differs from the one used for the 2D atlas.
-